Measurement Component
New in ScopeFoundry 2.1, generate a template using in your_project_folder:
python -m ScopeFoundry new_mm
This tutorial explains how to build the number_gen_readout measurement, which works with the ScopeFoundryHW package created in the previous tutorial. When executed, this measurement periodically samples values from the number_gen hardware component.
Essential Components
A ScopeFoundry Measurement is defined as a subclass of ScopeFoundry.Measurement and has a name:
import time

import numpy as np

from ScopeFoundry import Measurement, h5_io

class NumberGenReadoutSimple(Measurement):

    name = "number_gen_readout_simple"
Next, override the setup() and run() functions to define the measurement. In this example we will add three settings that will be used during the measurement.
    def setup(self):
        """
        Runs once during app initialization.
        This is where you define your settings and set up data structures.
        """

        s = self.settings
        s.New("sampling_period", float, initial=0.1, unit="s")
        s.New("N", int, initial=101)
        s.New("save_h5", bool, initial=True)
        self.data["y"] = np.ones(self.settings["N"])
When a measurement starts, a new thread is launched, and the run() function is eventually called. Override this method. First, sample values from the number_gen hardware component:
    def run(self):
        """
        Runs when the measurement starts. Executes in a separate thread from the GUI.
        It should not update the graphical interface directly and should focus only
        on data acquisition.
        """
        # Prepare an array for data in memory.
      	y = self.data["y"] = np.ones(self.settings["N"])

        # Get a reference to the hardware
        hw = self.app.hardware["number_gen"]


        # Sample the hardware for values N times
        for i in range(self.settings["N"]):

            # read data from device.
            y[i] = hw.settings.sine_data.read_from_hardware()

            # wait for the sampling period.
            time.sleep(self.settings["sampling_period"])

            self.set_progress(i * 100.0 / self.settings["N"])

            # break the loop if user desires.
            if self.interrupt_measurement_called:
                break
- The
interrupt_measurement_calledflag is set toTruewhen the user interrupts the measurement through the GUI. - The
set_progress()method updates the progress bar and calculates the estimated time remaining based on the progress percentage and the time the measurement started.
Second, save the data to an HDF5 file (if the user chooses). The following boilerplate code saves all settings from every hardware component and the measurement:
      if self.settings["save_h5"]:
          # Open a file
          self.h5_meas_group = h5_io.h5_base_file(app=self.app, measurement=self)

          # Create a measurement H5 group (folder) within self.h5file
          # This stores all the measurement metadata in this group
          self.h5_meas_group = h5_io.h5_create_measurement_group(
              measurement=self, h5group=self.h5_file
          )

          # Dump the dataset and close the file.
          for name, data in self.data.items():
              self.h5_meas_group.create_dataset(name=name, data=data)

          self.h5_file.close()
      if self.settings["save_h5"]:
          # saves data, closes file,
          self.save_h5(data=self.data)

          # ScopeFoundry 2.1 and later
          # self.save_h5 also sets self.dataset_metadata
          # which allows to save data in other formats
          import matplotlib.pyplot as plt

          plt.figure()
          plt.plot(y)
          plt.savefig(self.dataset_metadata.get_file_path(".png"))
          plt.close()
The Case for Using self.settings
- When saving data as described above, the values are added to the resulting file, which is useful for:
- Analyzing data.
- Reloading the values by dragging and dropping the file onto the app, restoring ScopeFoundry to the same state at a later time.
- ScopeFoundry automatically generates widgets in the left tree that users can use to set values.
- Provides a consistent way to access settings in other components. For example, here we referenced a setting from the
number_genhardware component, updated it, and retrieved a value. - Offers an easy way to generate a GUI and connect to widgets in GUIs, as demonstrated next.
Adding a Graphical User Interface
We use two Qt-based libraries to create the UI. Import them at the top of the file:
import pyqtgraph as pg
from qtpy import QtCore, QtWidgets
The GUI should be created at startup. Override the setup_figure function (called after the setup function). ScopeFoundry expects setup_figure to define self.ui with a widget.
Here, we define the GUI programmatically (alternatively, one can use Qt Creator, as explained below):
    def setup_figure(self):
        self.ui = QtWidgets.QWidget()
QtWidgets.QWidget() creates an empty widget.
To add widgets to self.ui, use a layout. (In Qt, widgets cannot be added directly to another widget.)
        layout = QtWidgets.QVBoxLayout()
        self.ui.setLayout(layout)
The type of layout determines how widgets are arranged. Here, QVBoxLayout stacks them vertically. ScopeFoundry provides convenience methods to create widgets that automatically update when settings values change and vice versa. Add widgets for the settings defined in the setup function and a start/stop button to the layout:
        layout.addWidget(self.settings.New_UI(include=("sampling_period", "N", "save_h5")))
        layout.addWidget(self.new_start_stop_button())
Finally, add the plot widget with axes and a line:
        self.graphics_widget = pg.GraphicsLayoutWidget(border=(100, 100, 100))
        self.plot = self.graphics_widget.addPlot(title=self.name)
        self.plot_lines = {}
        self.plot_lines["y"] = self.plot.plot(pen="g")
        layout.addWidget(self.graphics_widget)
ScopeFoundry repeatedly calls update_display() during a measurement. Override it as follows:
    def update_display(self):
        self.plot_lines["y"].setData(self.data["y"])
Note: You do not need to call update_display yourself. You can control how often it is called using the self.display_update_period attribute.
Putting Everything Together
We place a number_gen_readout_simple.py file next to the fancy_app.py.
# number_gen_readout_simple.py
import time

import numpy as np
import pyqtgraph as pg
from qtpy import QtCore, QtWidgets

from ScopeFoundry import Measurement, h5_io


class NumberGenReadoutSimple(Measurement):

    name = "number_gen_readout_simple"

    def setup(self):
        """
        Runs once during app initialization.
        This is where you define your settings and set up data structures.
        """

        s = self.settings
        s.New("sampling_period", float, initial=0.1, unit="s")
        s.New("N", int, initial=101)
        s.New("save_h5", bool, initial=True)
        self.data = {"y": np.ones(self.settings["N"])}

    def run(self):
        """
        Runs when the measurement starts. Executes in a separate thread from the GUI.
        It should not update the graphical interface directly and should focus only
        on data acquisition.
        """
        # Prepare an array for data in memory.
        y = self.data["y"] = np.ones(self.settings["N"])

        # Get a reference to the hardware
        hw = self.app.hardware["number_gen"]

        # Sample the hardware for values N times
        for i in range(self.settings["N"]):

            # read data from device.
            y[i] = hw.settings.get_lq("sine_data").read_from_hardware()

            # wait for the sampling period.
            time.sleep(self.settings["sampling_period"])

            self.set_progress(i * 100.0 / self.settings["N"])

            # break the loop if user desires.
            if self.interrupt_measurement_called:
                break

        if self.settings["save_h5"]:
            # saves data, closes file,
            self.save_h5(data=self.data)

            # ScopeFoundry 2.1 and later
            # self.save_h5 also sets self.dataset_metadata
            # which allows to save data in other formats
            import matplotlib.pyplot as plt

            plt.figure()
            plt.plot(y)
            plt.savefig(self.dataset_metadata.get_file_path(".png"))
            plt.close()

    def setup_figure(self):
        """
        Runs once during App initialization and is responsible
        to create widget self.ui.
        Create plots, controls widgets and buttons here.
        """
        self.ui = QtWidgets.QWidget()

        layout = QtWidgets.QVBoxLayout()
        self.ui.setLayout(layout)
        layout.addWidget(
            self.settings.New_UI(include=("sampling_period", "N", "save_h5"))
        )
        layout.addWidget(self.new_start_stop_button())
        self.graphics_widget = pg.GraphicsLayoutWidget(border=(100, 100, 100))
        self.plot = self.graphics_widget.addPlot(title=self.name)
        self.plot_lines = {"y": self.plot.plot(pen="g")}
        layout.addWidget(self.graphics_widget)

    def update_display(self):
        self.plot_lines["y"].setData(self.data["y"])

    # ---------------------------------------------------------------------------
    ## UNCOMMENT IF YOU HAVE SCOPEFOUNDRY 2.0 OR EARLIER
    # ---------------------------------------------------------------------------

    # def open_new_h5_file(self):
    #     """remove me if you have ScopeFoundry 2.1+"""
    #     self.close_h5_file()

    #     self.h5_file = h5_io.h5_base_file(self.app, measurement=self)
    #     self.h5_meas_group = h5_io.h5_create_measurement_group(self, self.h5_file)

    #     return self.h5_meas_group

    # def close_h5_file(self):
    #     if hasattr(self, "h5_file") and self.h5_file.id is not None:
    #         self.h5_file.close()

    # def save_h5(self, data):
    #     self.open_new_h5_file(data)
    #     self.close_h5_file()
We add this Measurement to the app using the add_measurement() method:
# fancy_app.py
import sys

from ScopeFoundry import BaseMicroscopeApp

class FancyApp(BaseMicroscopeApp):

    name = "fancy app"

    def setup(self):
        """
        Runs once during app initialization. This is where you add hardware
        and measurements to the app.
        """

        # Add hardware
        from ScopeFoundryHW.random_number_gen import NumberGenHW
        self.add_hardware(NumberGenHW(self))

        # Add measurement
        from measurements.number_gen_readout_simple import NumberGenReadoutSimple
        self.add_measurement(NumberGenReadoutSimple(self))

if __name__ == "__main__":
    app = FancyApp(sys.argv)
    # Optionally load default settings
    # app.settings_load_ini("default_settings.ini")
    sys.exit(app.exec_())
To run the app, execute the following command in your terminal:
python fancy_app.py
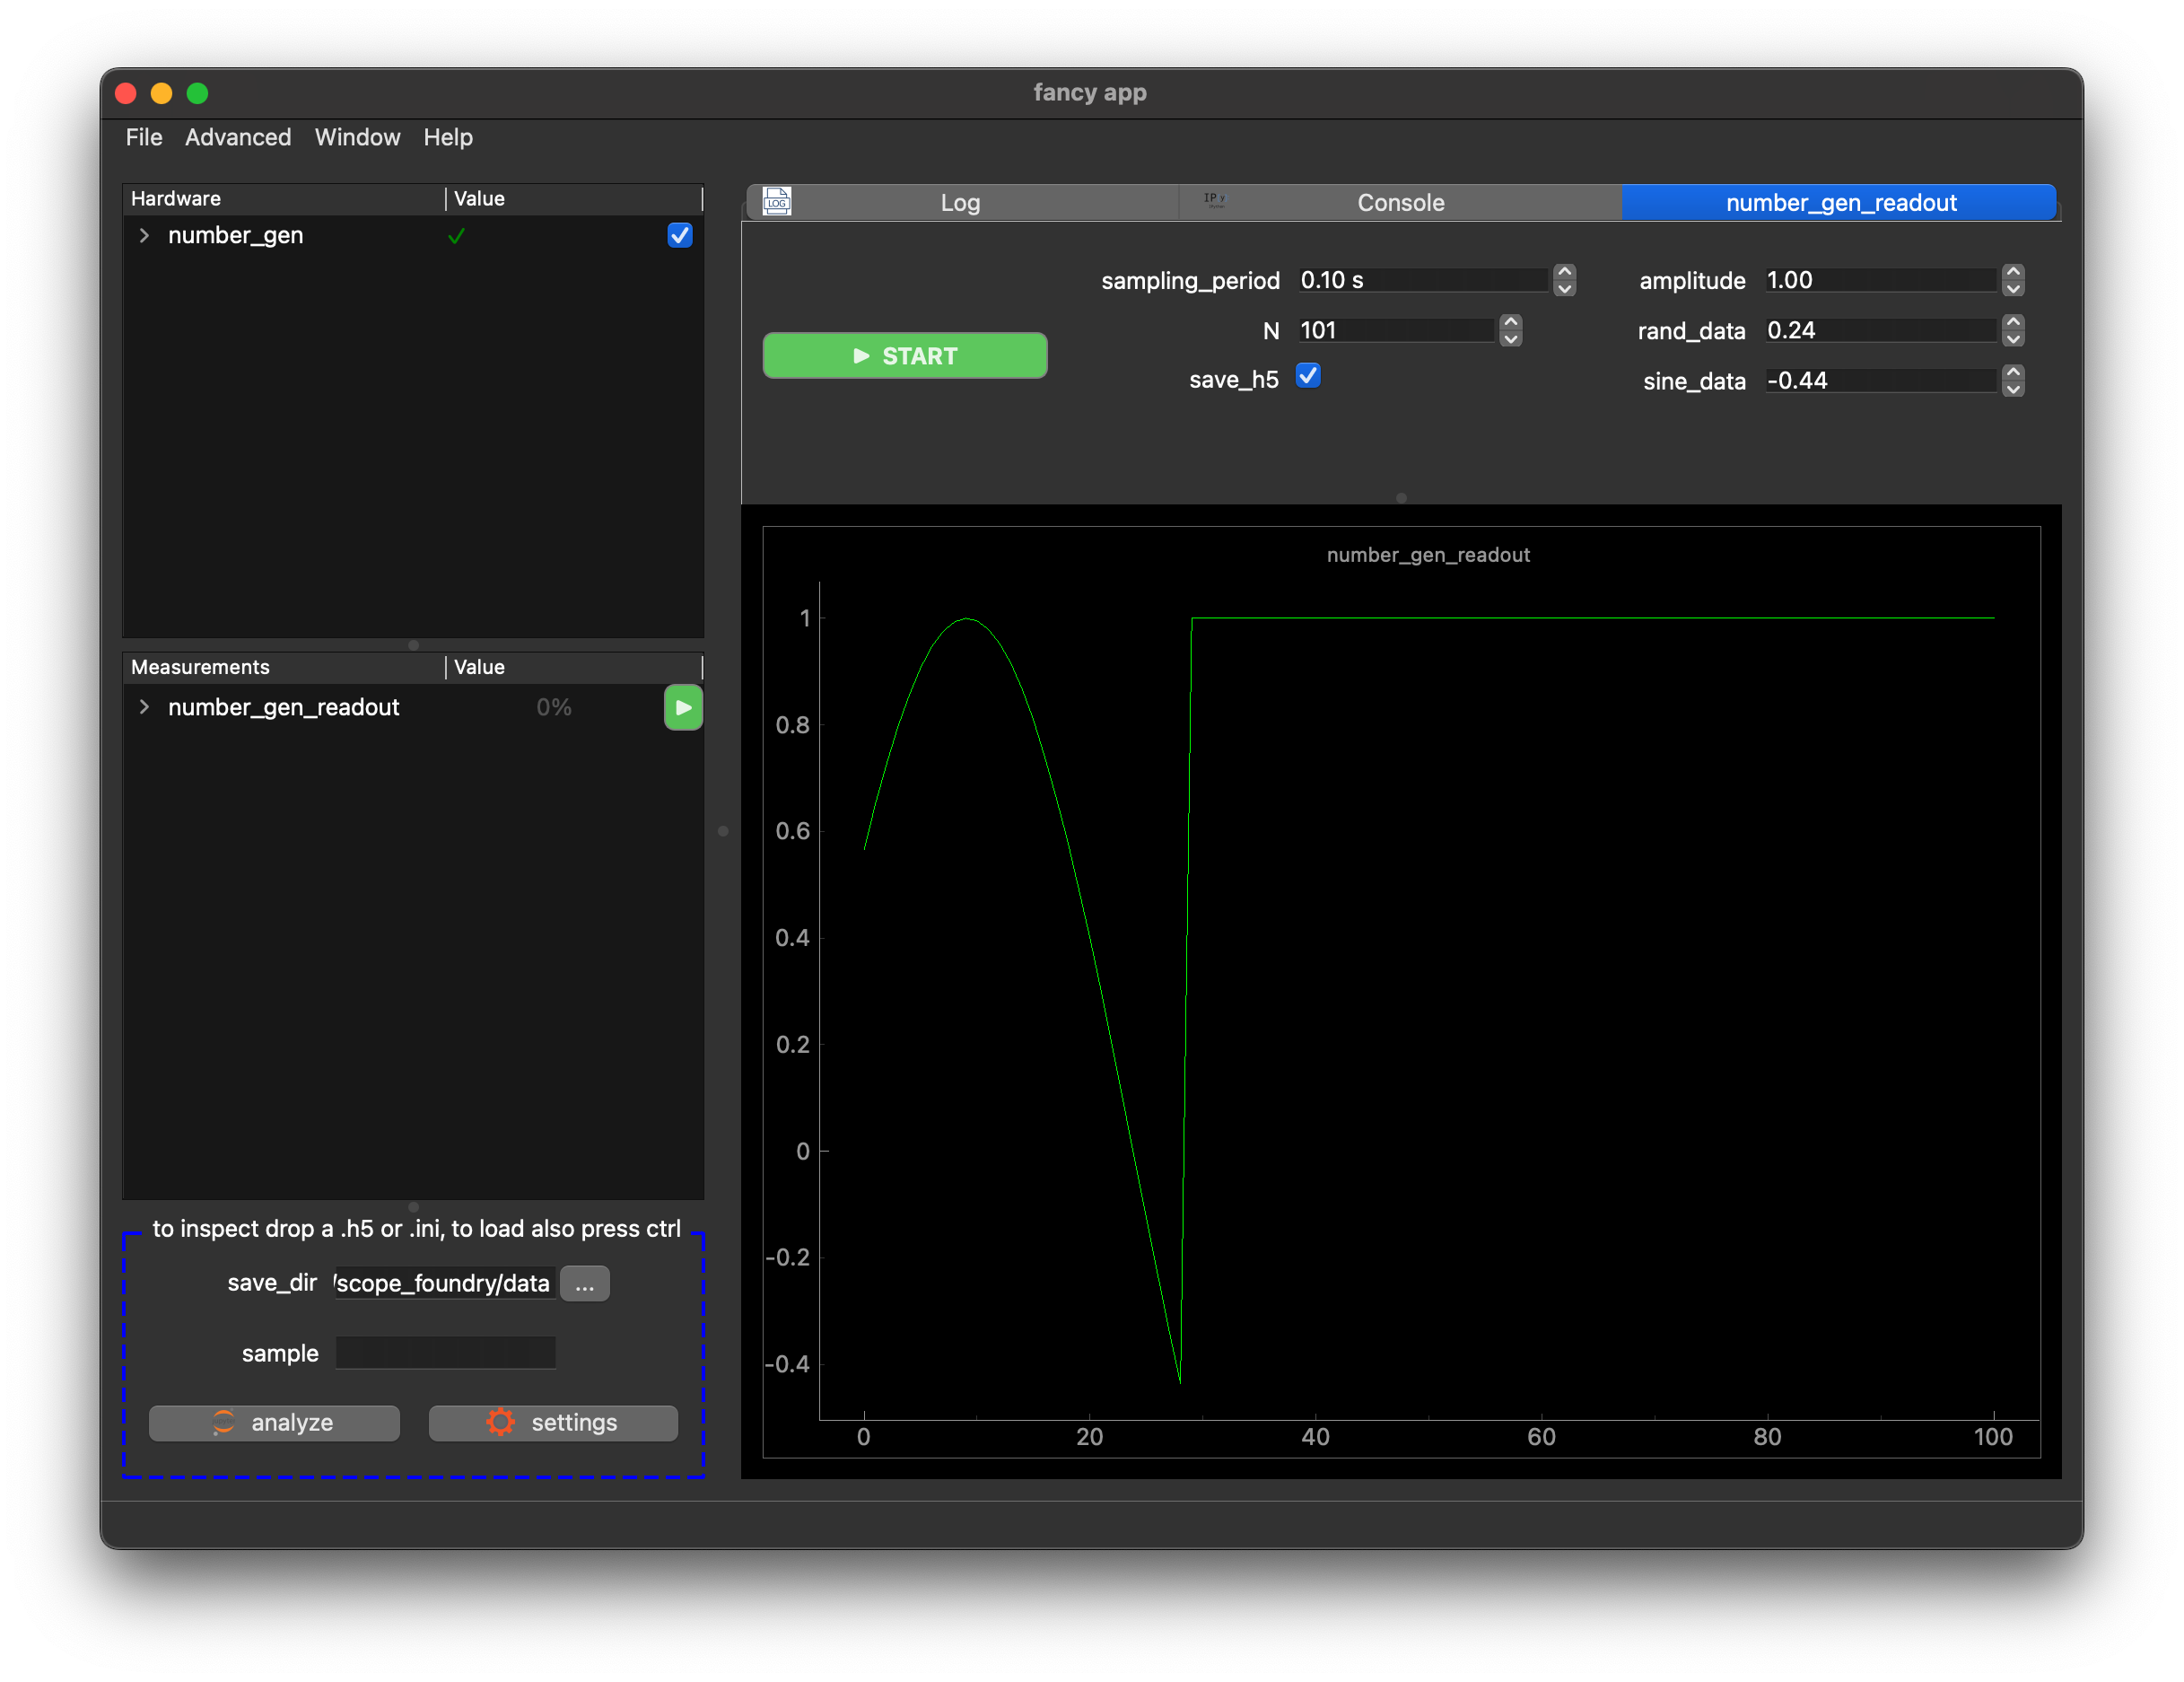
When executed, the app will display a graphical interface with the measurement and hardware components integrated.
Next Steps
- More on hardware.
- Analyze with Jupyter Notebook.
- You can access the code for this tutorial here.
Bonus: Build the User Interface with Qt Creator
In the above implementation, we created the figure programmatically. However, we could also use Qt Creator to design a user interface.
- Download the free Qt Creator.
- Create a
.uifile. The one used here,number_gen_readout.ui, can be found in the tutorial repository.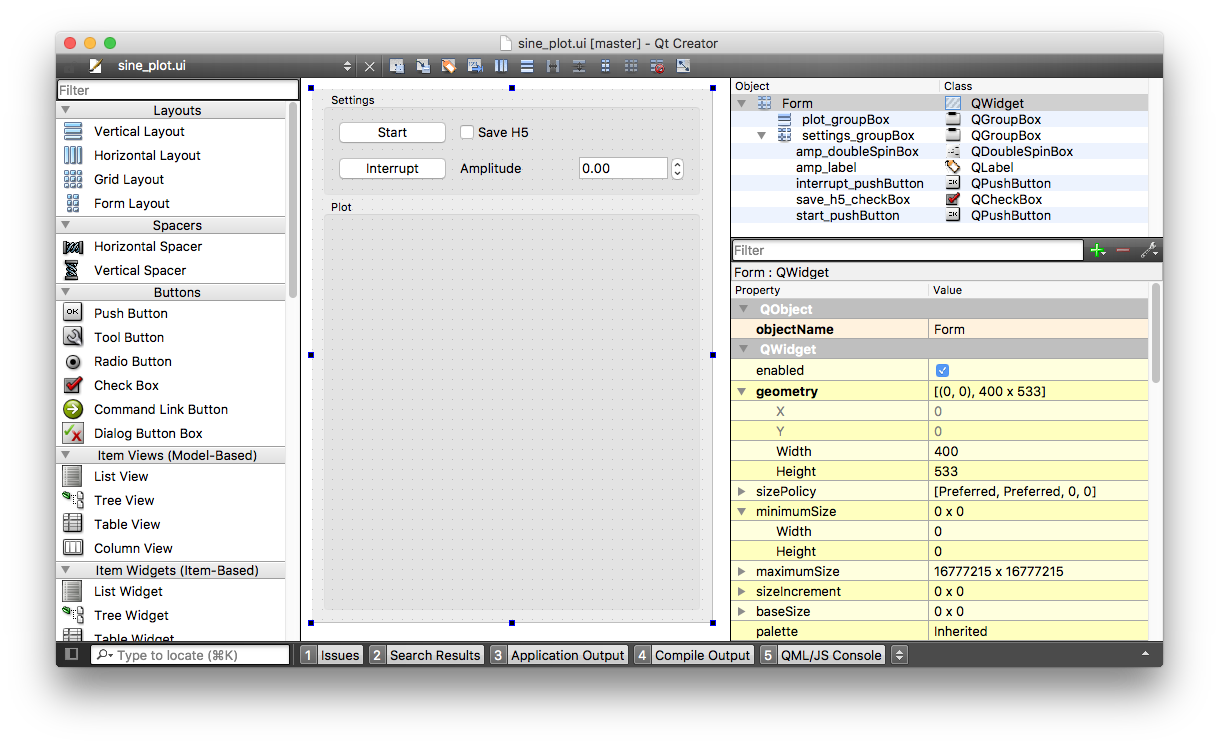
- Save the
.uifile next to the measurement file (sibling path). - Adjust the
setup_figure()method of the measurement:
  	def setup_figure(self):
        ui_filename = sibling_path(__file__, "number_gen_readout.ui")
        self.ui = load_qt_ui_file(ui_filename)
        self.hw = self.app.hardware["number_gen"]

        # connect ui widgets to measurement/hardware settings or functions
        self.settings.activation.connect_to_pushButton(self.ui.start_pushButton)
        self.settings.save_h5.connect_to_widget(self.ui.save_h5_checkBox)

        self.hw.settings.amplitude.connect_to_widget(self.ui.amp_doubleSpinBox)

        # Set up pyqtgraph graph_layout in the UI
        self.graph_layout = pg.GraphicsLayoutWidget()
        self.ui.plot_groupBox.layout().addWidget(self.graph_layout)

        # Create PlotItem object (a set of axes)
        self.plot = self.graph_layout.addPlot(title=self.name)
        # Create PlotDataItem object ( a scatter plot on the axes )
        self.plot_lines = {"y": self.plot.plot(pen="g")}
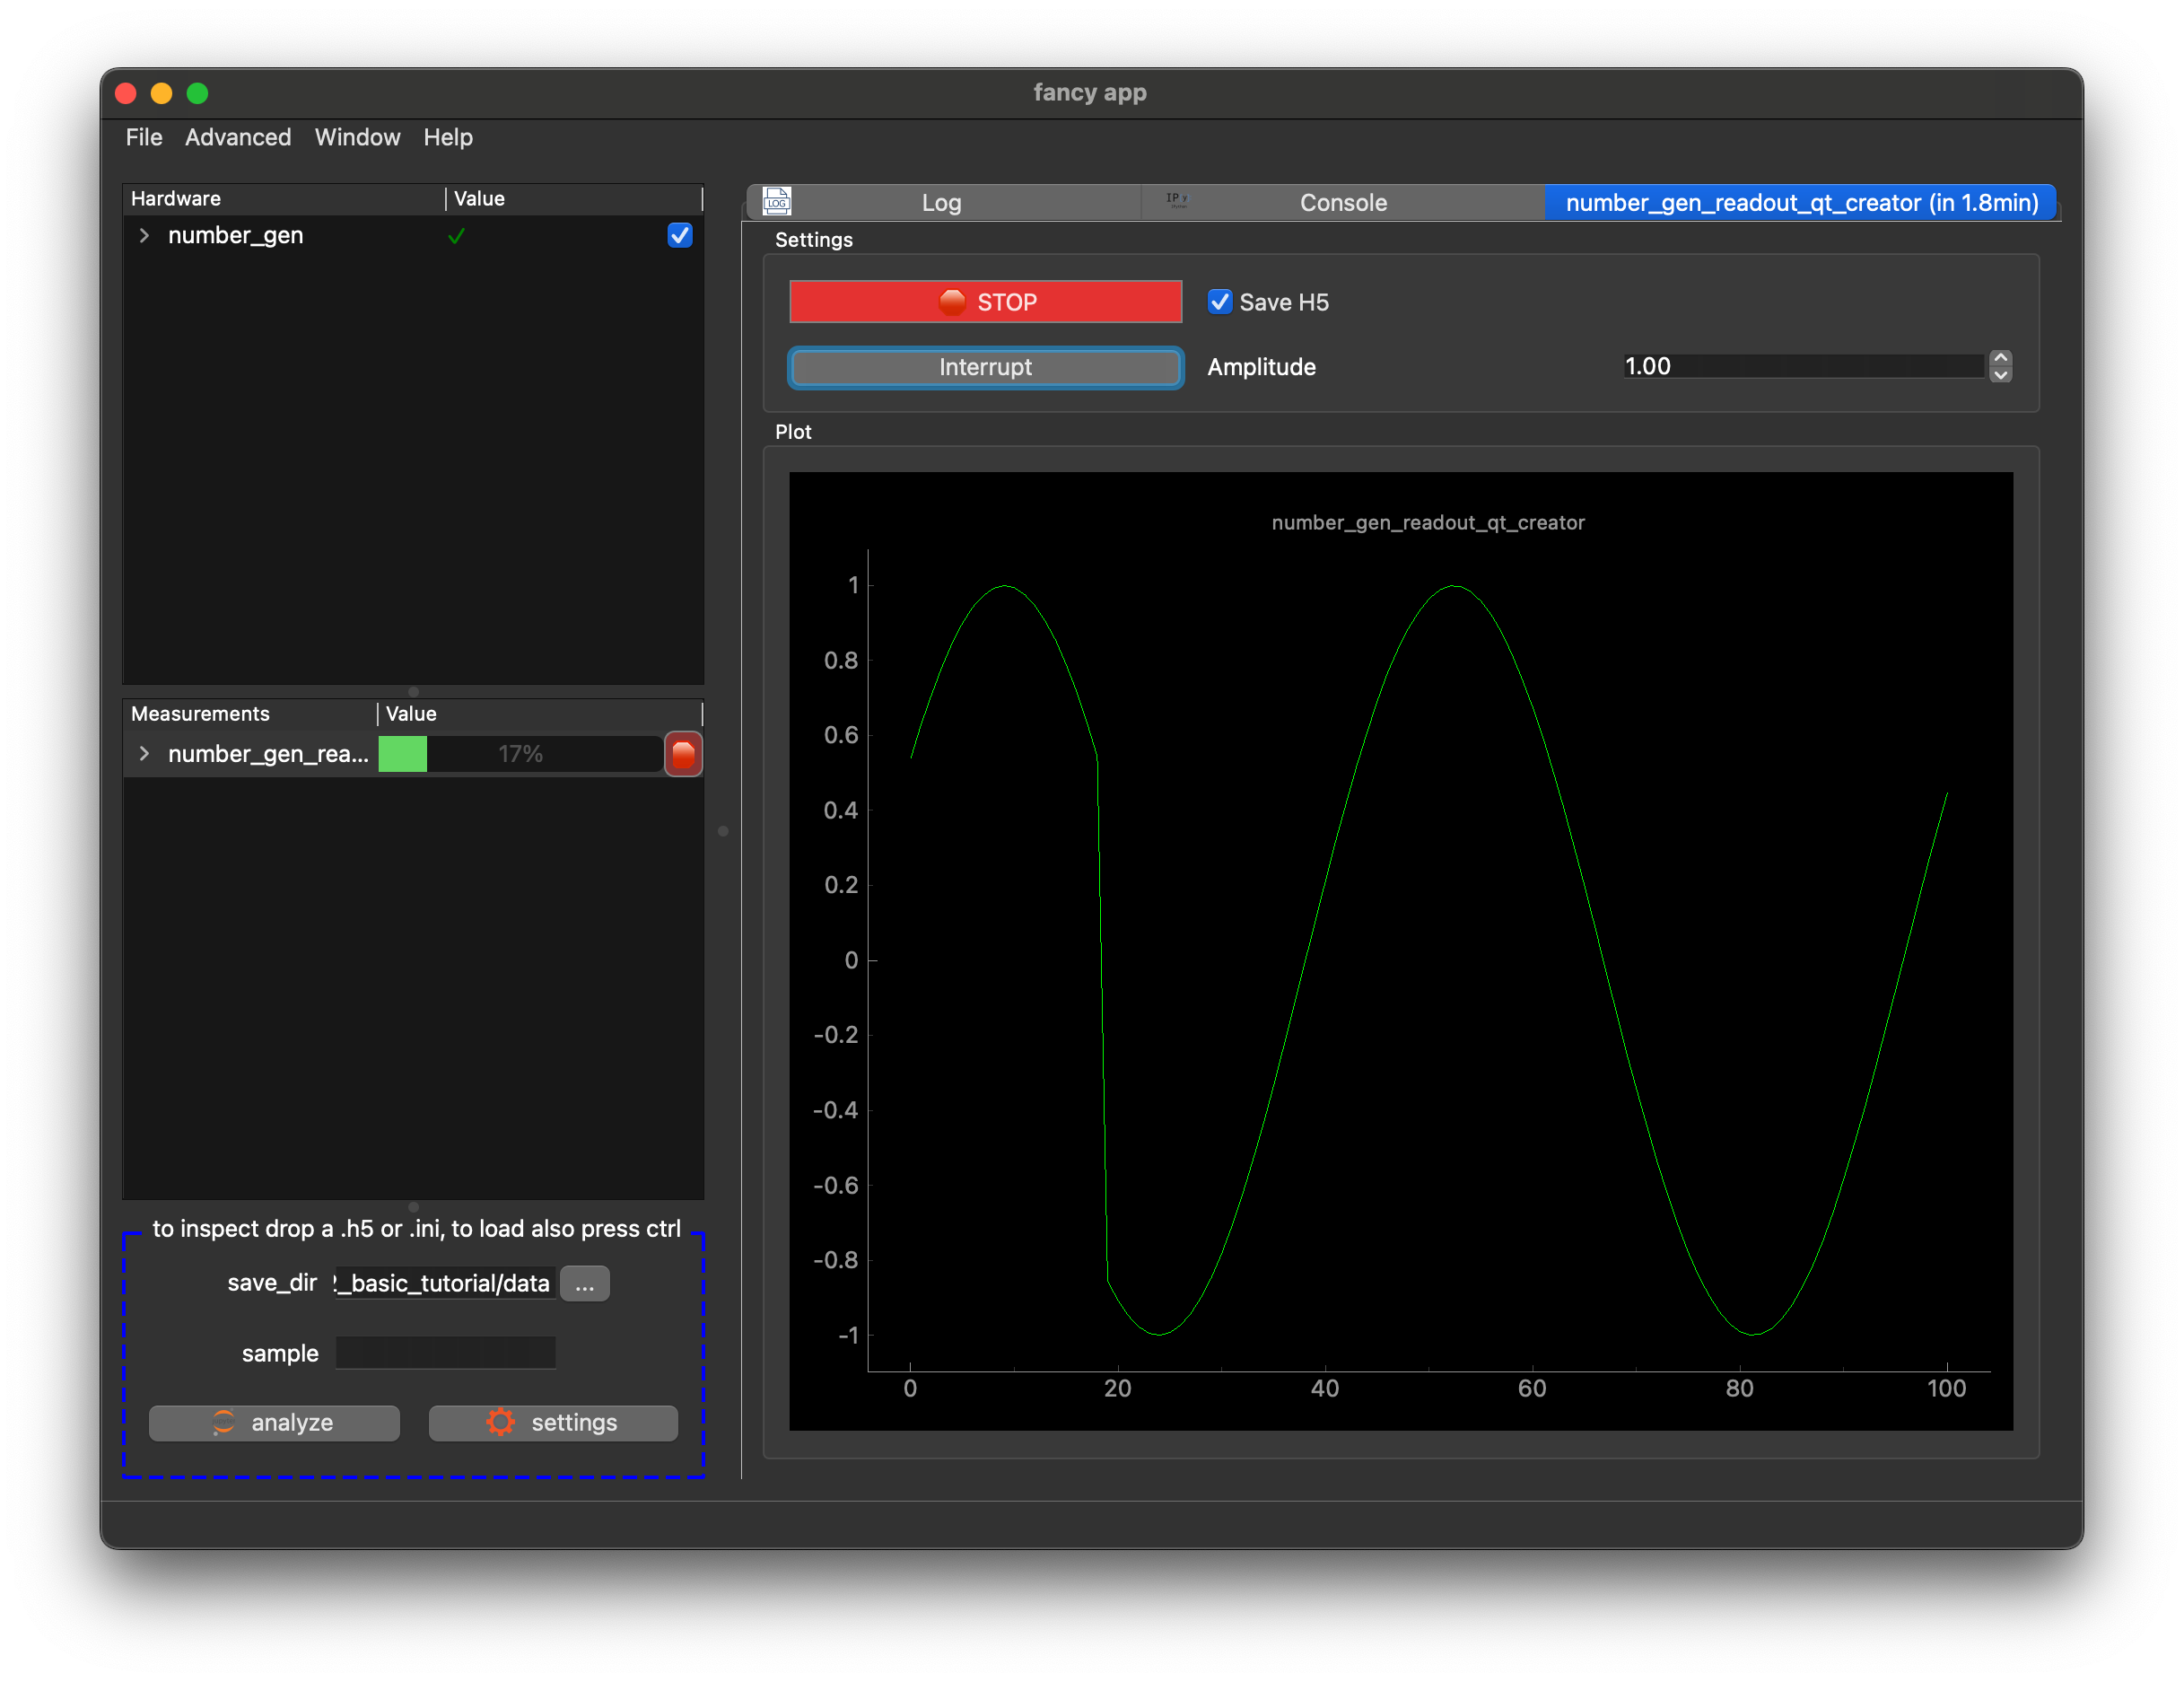
The resulting app should look like this:
Bonus 2: Extendable Dataset
In the above example, we kept things simple. We made some modifications in this final version that has the following improvements:
run():- The measurement runs indefinitely or until the user hits STOP.
- Data is dumped to the file during the measurement, ensuring that data is stored even if the program crashes.
- Since we do not know the dataset length beforehand, we made it extendable.
setup_figure():- Uses a splitter instead of
QVBoxLayout. - Includes settings from the hardware.
- Uses a splitter instead of
# number_gen_readout_extendable_dataset.py
import time

import numpy as np
import pyqtgraph as pg
from qtpy import QtCore, QtWidgets

from ScopeFoundry import Measurement, h5_io


class NumberGenReadoutExtendableDataset(Measurement):

    name = "number_gen_readout_extendable_dataset"

    def setup(self):
        """
        Runs once during app initialization.
        This is the place to load a user interface file,
        define settings, and set up data structures.
        """

        s = self.settings
        s.New("sampling_period", float, initial=0.1, unit="s")
        s.New("N", int, initial=101)
        s.New("save_h5", bool, initial=True)

        # Data structure of the measurement
        self.data = {"y": np.ones(101)}
        self.hw = self.app.hardware["number_gen"]

    def setup_figure(self):
        """Create a figure programmatically."""

        # Create a layout that holds all measurement controls and settings from hardware
        cb_layout = QtWidgets.QHBoxLayout()
        cb_layout.addWidget(self.new_start_stop_button())
        cb_layout.addWidget(
            self.settings.New_UI(
                exclude=("activation", "run_state", "profile", "progress")
            )
        )
        # Add hardware settings to the layout
        cb_layout.addWidget(
            self.hw.settings.New_UI(exclude=("debug_mode", "connected", "port"))
        )
        header_widget = QtWidgets.QWidget()
        header_layout = QtWidgets.QVBoxLayout(header_widget)
        header_layout.addLayout(cb_layout)

        # Create a plot widget containing a single line
        self.graphics_widget = pg.GraphicsLayoutWidget(border=(100, 100, 100))
        self.plot = self.graphics_widget.addPlot(title=self.name)
        self.plot_lines = {}
        self.plot_lines["y"] = self.plot.plot(pen="g")

        # Combine everything
        # ScopeFoundry assumes .ui is the main widget:
        self.ui = QtWidgets.QSplitter(QtCore.Qt.Orientation.Vertical)
        self.ui.addWidget(header_widget)
        self.ui.addWidget(self.graphics_widget)

    def update_display(self):
        self.plot_lines["y"].setData(self.data["y"])

    def run(self):
        """
        Runs when the measurement is started. Executes in a separate thread from the GUI.
        It should not update the graphical interface directly and should only
        focus on data acquisition.
        """

        # A buffer in memory for data
        self.data["y"] = np.ones(self.settings["N"])

        if self.settings["save_h5"]:
            self.open_new_h5_file()
            self.h5_y = h5_io.create_extendable_h5_like(
                h5_group=self.h5_meas_group, name="y", arr=self.data["y"], axis=0
            )

        # Use a try/finally block to ensure cleanup, e.g., closing the data file object.
        try:
            i = 0
            i_extended = 0

            # Run indefinitely or until interrupted
            while not self.interrupt_measurement_called:
                i %= self.settings["N"]

                # Update progress bar percentage
                self.set_progress(i * 100.0 / self.settings["N"])

                # Fill the buffer with sine wave readings from the hardware
                val = self.hw.settings.sine_data.read_from_hardware()
                self.data["y"][i] = val

                if self.settings["save_h5"]:
                    # Extend h5 data file if needed.
                    if i_extended >= len(self.h5_y):
                        self.h5_y.resize(i_extended + self.settings["N"], axis=0)

                    self.h5_y[i_extended] = val
                    self.h5_file.flush()

                # Wait between readings
                time.sleep(self.settings["sampling_period"])

                i += 1
                i_extended += 1

        finally:
            print(self.name, "finished")
            if self.settings["save_h5"]:
                # Ensure the data file is closed
                self.close_h5_file()
                print(self.name, "saved")

    # ---------------------------------------------------------------------------
    ## UNCOMMENT IF YOU HAVE SCOPEFOUNDRY 2.0 OR EARLIER
    # ---------------------------------------------------------------------------

    # def open_new_h5_file(self):
    #     """remove me if you have ScopeFoundry 2.1+"""
    #     self.close_h5_file()

    #     self.h5_file = h5_io.h5_base_file(self.app, measurement=self)
    #     self.h5_meas_group = h5_io.h5_create_measurement_group(self, self.h5_file)

    #     return self.h5_meas_group

    # def close_h5_file(self):
    #     if hasattr(self, "h5_file") and self.h5_file.id is not None:
    #         self.h5_file.close()

    # def save_h5(self, data):
    #     self.open_new_h5_file(data)
    #     self.close_h5_file()
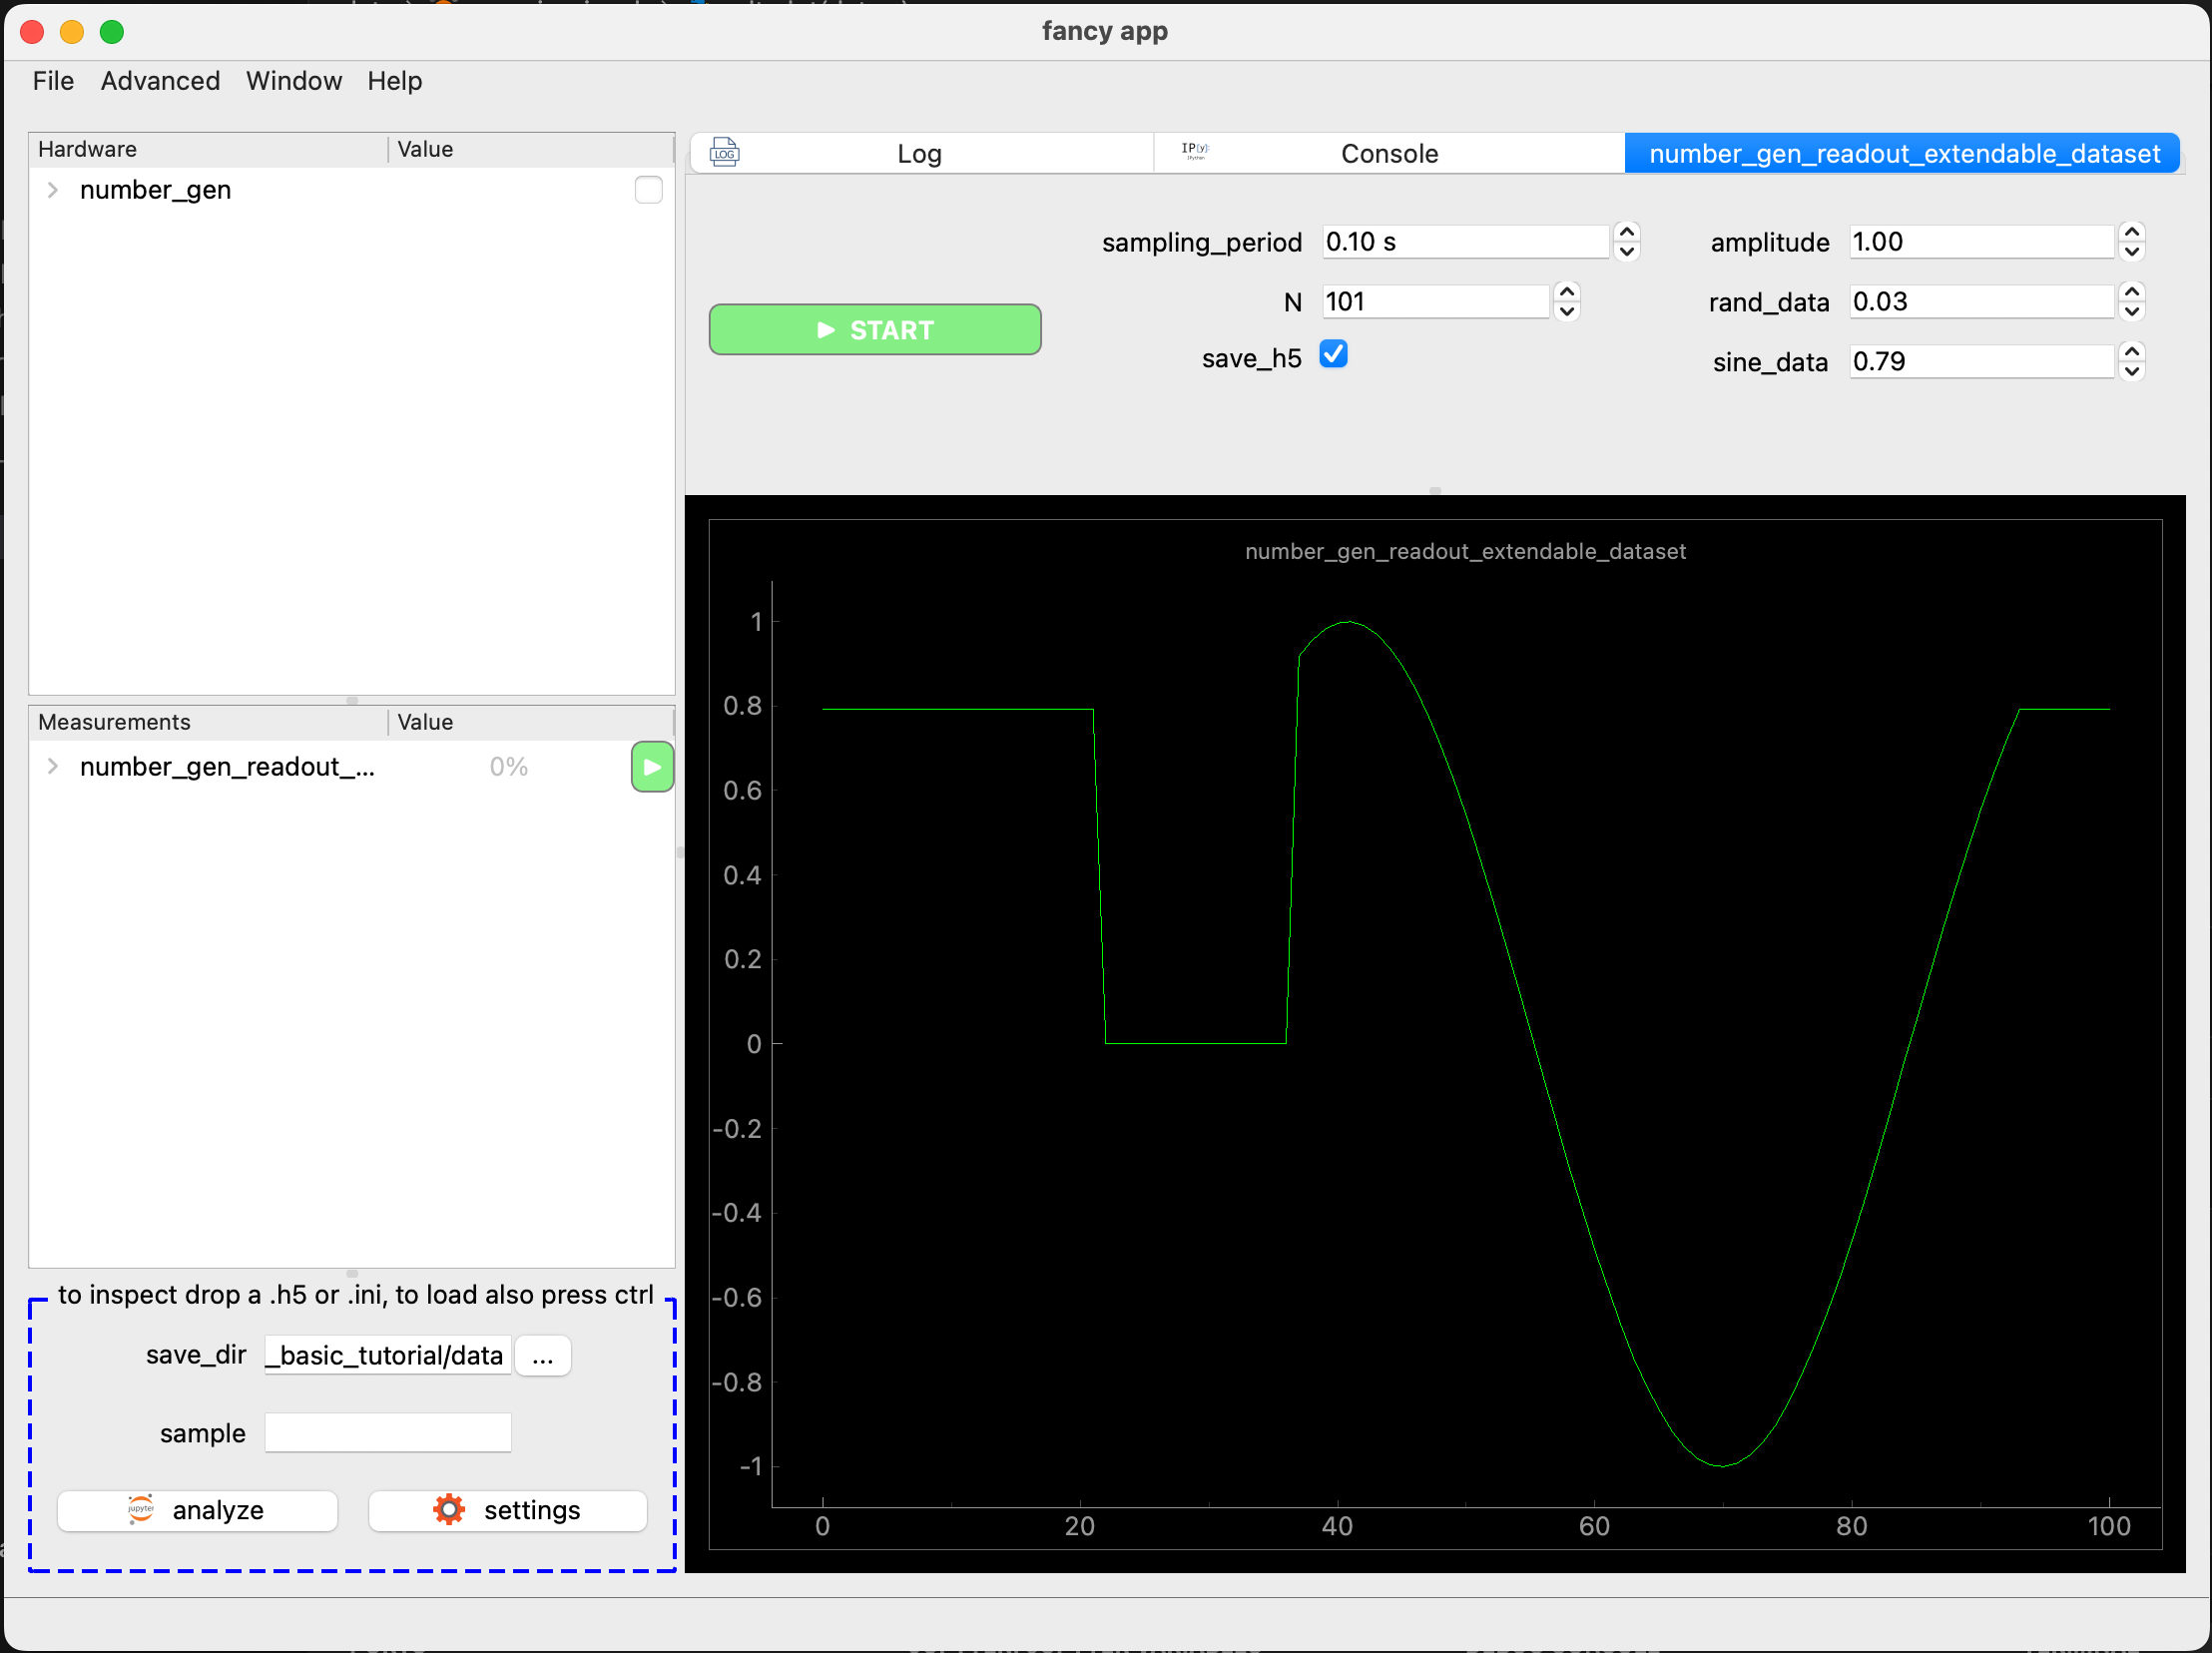
Result:
Next Steps
- More on hardware.
- Analyze with Jupyter Notebook.
- You can access the code for this tutorial here.